Why corrosion monitoring matters
Corrosion in cooling-water systems can thin metal surfaces, cause leaks, reduce equipment reliability and increase maintenance costs. A corrosion coupon provides a practical way to estimate metal loss under the conditions experienced by the system. When installed and evaluated correctly, coupon results help engineers assess the performance of a water-treatment programme and identify changes that require investigation.
What is a corrosion coupon?
A corrosion coupon is a prepared metal specimen—often carbon steel for carbon-steel equipment—exposed to circulating water for a defined period. Its material, surface condition, exposed area and installation method should be documented. After exposure, corrosion products are removed using an appropriate standardized cleaning procedure, and the coupon is weighed again. The difference between its initial and final mass is used to calculate an average corrosion rate.
The basic measurement procedure
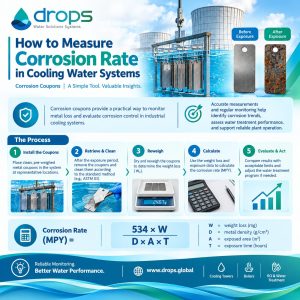
- Record the initial condition — Use a suitable coupon, record its material and dimensions, and measure its initial mass accurately.
- Install and expose — Place the coupon in a suitable rack where flow and operating conditions are representative. Record installation and removal dates, location and relevant operating changes.
- Retrieve and clean — Remove the coupon carefully. Clean corrosion products using an appropriate standard method that minimizes removal of the base metal, then dry and weigh it.
- Calculate and review — Calculate mass loss and corrosion rate, check the result for plausibility, and interpret it alongside water chemistry, treatment dosage and operating records.
Corrosion rate calculation
When weight loss (W) is measured in milligrams, metal density (D) in g/cm³, exposed area (A) in square inches and exposure time (T) in hours, the corrosion rate in mils per year (MPY) can be calculated as:
Corrosion rate (MPY) = 534 × W / (D × A × T)
Where W = weight loss (mg), D = metal density (g/cm³), A = exposed area (in²), and T = exposure time (hours). Use consistent units and the exact exposed area specified by the applicable method. For carbon steel, a commonly used density value is approximately 7.86 g/cm³; use the appropriate value for the coupon material.
How should results be interpreted?
A coupon reports an average metal-loss rate over its exposure period; it does not show every local condition. Pitting, under-deposit attack, microbiologically influenced corrosion and differences in flow can be missed or understated by a single average value. Compare results over time and, where appropriate, use multiple coupons or complementary methods such as visual inspection, water analysis and deposit examination. Evaluate trends against the site’s material-specific criteria rather than relying on a universal pass/fail number.
Good practice for reliable results
- Use a consistent coupon material, preparation method, rack location and exposure procedure when comparing trends.
- Document water chemistry, temperature, flow conditions, chemical dosing and any operational interruptions.
- Follow a recognized coupon-cleaning and evaluation standard; improper cleaning can distort the calculated metal loss.
- Treat unusual results as a prompt to investigate, not as proof of a single cause.
Conclusion
Corrosion coupons turn metal loss into a measurable trend. Combined with sound sampling, consistent procedures and operating data, they give water-treatment teams a useful tool for evaluating system condition and the effectiveness of corrosion control. The most valuable result is not one number in isolation, but a reliable trend that supports informed maintenance and treatment decisions.